Usage
Creating a Python code to retrieve a time series
Import the wtss class and then use it to create an object to retrieve the time series as shown in the following example:
Note
If you would like to access Brazil Data Cube Time Series, you must have an Account and give the User Personal Access Token to the service instantiation like below:
from wtss import *

service = WTSS('https://brazildatacube.dpi.inpe.br', access_token='CHANGE_ME')
The object service allows to list the available coverages:
print(service.coverages)
Result:
['MOD13Q1-6', 'MYD13Q1-6', 'S2-casassola_10-1', 'S2-casassola_10_16D_STK-1', 'S2QMD_10_16D_STK-1', 'S2QMD_10-1', 'S2-recent_10_16D_STK-1', 'S2-SEN2COR_10_16D_STK-1', 'LT5-MTA-CS_30_3M_STK-1', 'LT5-MTA-N_30_3M_STK-1', 'LT5-CAT_30_3M_STK-1', 'CB4MUX_20-1', 'LC8_30_16D_STK-1', 'CB4MUX_20_1M_STK-1', 'LC8-MOSAIC_30-1', 'LC8_30_6M_MEDSTK-1', 'CB4_64_16D_STK-1', 'LANDSAT-MOZ_30_1M_STK-1', 'S2V3_10_16D_LCF-1', 'S2-16D-2', 'CBERS-WFI_64_8D_LCF-1']
It also allows to retrieve a coverage object with its metadata:
coverage = service['MOD13Q1-6']

print(coverage)
Result:
Coverage: MOD13Q1-6
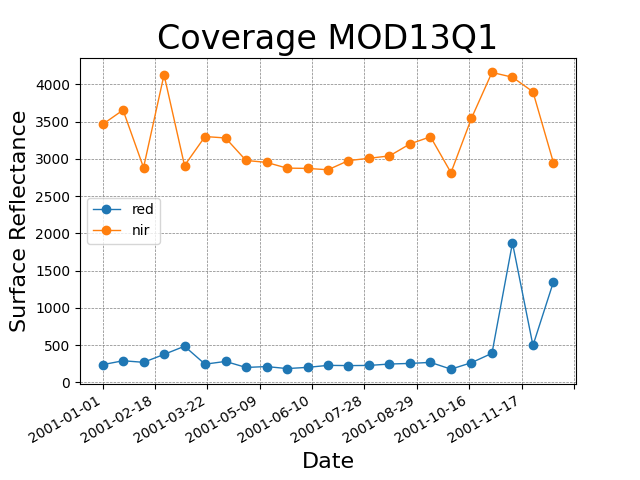
In order to retrieve the time series for attributes red_reflectance and NIR_reflectance, in the location of latitude -12 and longitude -54 from January 1st, 2001 tp December 31st, 2001, use the ts method:
ts = coverage.ts(attributes=('red_reflectance', 'NIR_reflectance'),
                 latitude=-12.0, longitude=-54.0,
                 start_date='2001-01-01', end_date='2001-12-31')
Then, you can access the time series values through the name of the attributes:
print('red values:', ts.red_reflectance)

print('nir values:', ts.NIR_reflectance)
Result:
red values: [236.0, 289.0, ..., 494.0, 1349.0]

nir values: [3463.0, 3656.0, ..., 3901.0, 2948.0]
It is also possible to access the time points associated to the values:
print(ts.timeline)
Result:
[datetime.date(2001, 1, 1), ..., datetime.date(2001, 12, 19)]
If you have Matplotlib and Numpy, it is possible to plot the time series with the plot method:
ts.plot()
More examples can be found in the Section Examples.
Command-Line Interface (CLI)
The WTSS client installs a command line tool named wtss that allows to retrive time series data.
If you want to know the WTSS version, use the option --version as in:
wtss --version
Output:
wtss, version 0.7.0
To list the available coverages in a service, use the list-coverages command and provides a URL to the --url option:
wtss list-coverages --url https://brazildatacube.dpi.inpe.br
Output:
MOD13Q1-6
MYD13Q1-6
S2-SEN2COR_10_16D_STK-1
LC8_30_16D_STK-1
CB4MUX_20_1M_STK-1
LC8_30_6M_MEDSTK-1
CB4_64_16D_STK-1
LANDSAT-MOZ_30_1M_STK-1
CBERS-WFI_64_8D_LCF-1
To get more information about a specific coverage, use the describe command:
wtss describe --coverage MOD13Q1-6 --url https://brazildatacube.dpi.inpe.br
Output:
{
    "name": "MOD13Q1-6",
    "description": "Vegetation Indices 16-Day L3 Global 250m",
    "detail": "https://lpdaac.usgs.gov/dataset_discovery/modis/modis_products_table/mod13q1_v006",
    "dimensions": { },
    "spatial_extent": { },
    "spatial_resolution": { },
    "crs": { },
    "timeline": [ ],
    "attributes": [ ]
}
Finally, to retrieve the time series over a coverage in a specific location:
wtss ts --coverage MOD13Q1-6 \
        --attributes red \
        --longitude -54 --latitude -12 \
        --start-date 2001-01-01 --end-date 2001-12-31 \
        --url https://brazildatacube.dpi.inpe.br \
        --access-token CHANGE_ME
Note
You may also need to pass the parameter --access_token=CHANGE_ME to retrieve time series.
If you want to know more about commands and their options, use the help:
wtss --help

wtss describe --help