TimeSeries
- class wtss.timeseries.TimeSeries(coverage, data)
A class that represents a time series in WTSS.
Note
For more information about time series definition, please, refer to WTSS specification.
- __init__(coverage, data)
Create a TimeSeries object associated to a coverage.
- Parameters:
coverage (Coverage) – The coverage that this time series belongs to.
- property timeline
Return the timeline associated to the time series.
- property attributes
Return a list with attribute names.
- values(attr_name)
Return the time series for the given attribute.
- plot(**options)
Plot the time series on a chart.
- Keyword Arguments:
attributes (sequence) – A sequence like (‘red’, ‘nir’) or [‘red’, ‘nir’] .
line_styles (sequence) – Not implemented yet.
markers (sequence) – Not implemented yet.
line_width (numeric) – Not implemented yet.
line_widths (sequence) – Not implemented yet,
labels (sequence) – Not implemented yet.
- Raises:
ImportError – If Maptplotlib or Numpy can no be imported.
Example
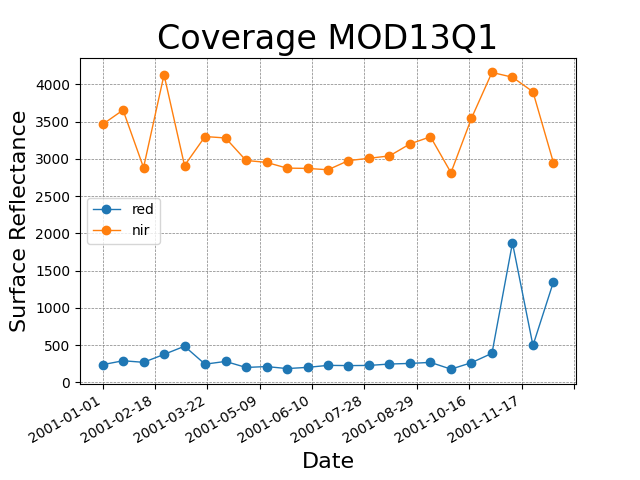
Plot the time series of MODIS13Q1 data product:
>>> from wtss import *
>>> service = WTSS(WTSS_EXAMPLE_URL)
>>> coverage = service['MOD13Q1']
>>> ts = coverage.ts(attributes=('red', 'nir'),
...                  latitude=-12.0, longitude=-54.0,
...                  start_date='2001-01-01', end_date='2001-12-31')
...
>>> ts.plot()
This will produce the following time series plot:
Note
You should have Matplotlib and Numpy installed. See wtss.py install notes for more information.